Power BI: Dynamic Title - Ranking & Top N Slicer with What if Parameter.
This project was created by using an Open Source flatefile dataset (CSV) exported from Zillow.com. The original file contains 271 columns and more than 30,000 rows. The data shows monthly Home Value Index populated by Zillow from January, 2000 to December, 2021 across the regions (zipcode, city, metro, state). I used Power Query to clean and extract data, created one fact table and two dimension tables (Calendar and Geographic) and also imported/merged an extra file for a full state name which did not exist in the original file. After creating data modeling between tables, I used DAX to perform calculations for needed metrics and dynamic ranking in each geographic level. I also create a dynamic title/head line that will change the visualization based on selected filters. I added What If Parameters to the reports as slicers to let the user choose the ranking by Top N.
Please view the sections below and see my DAX for this project on GitHub.
Data Source:
This project uses flatefile dataset (CSV) exported from Zillow.com.
Data Preparation: Power Query, DAX, Modeling
- Data Cleansing and Preparing with Power Query
Original data is in CSV file contains 271 columns and more than 30,000 rows. Connect data source to Power BI then use Power Query to prepare data.

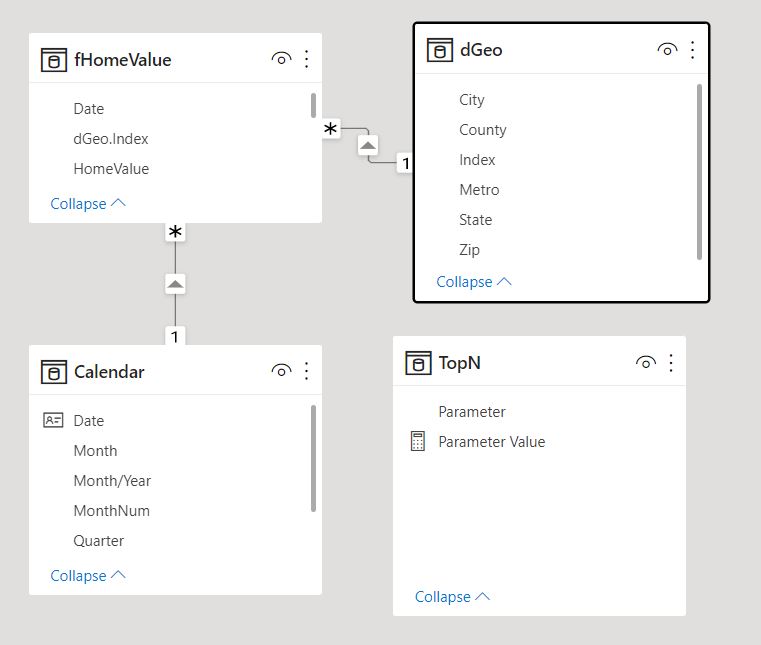
- Create Fact table and Dimension tables
Fact table (fHomeValue)

Dimension table (dGeo)

Date Table (Calendar)

Data Modeling with Power BI Desktop Connect tables together - perform data modeling.

Data Analysis and Reporting
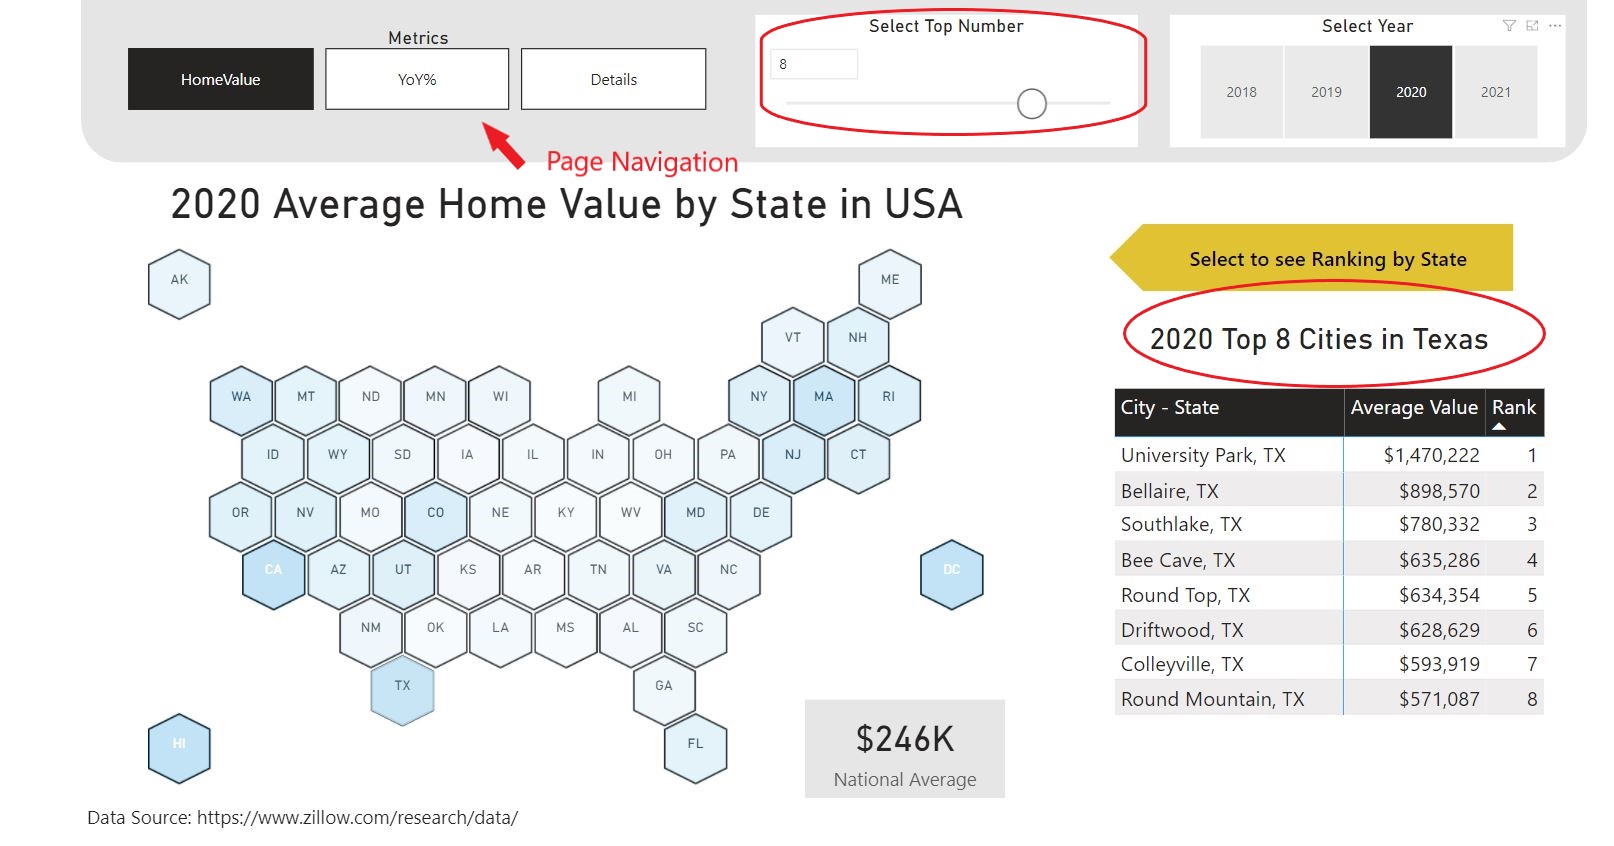
Create Measures with DAX , Slicer with What If Parameter function, Dynamic Ranking and Dynamic Titles/Headers


Data Visualization:
Use the Synoptic Panel for Hex Map, Card visuals to display dynamic titles/headers, Matrix visual for ranking and data detail table, Slicers for Top N selections. Finally, add Buttons to navigate other metrics.
Check my homepage here: Siri Shultz - Power BI
Other examples in my portfolio: My Portfolio