About Workout Wednesday Challenges.
Workout Wednesday is a weekly challenge to re-create data-driven visualizations. The challenges are designed to kick-start personal development in Tableau and Power BI. Each Wednesday, a challenge is released and participants are asked to replicate the challenge as closely as possible using their own Power BI Skills. Learn more about the challenges >>
I've been enjoying working with the DFW Power BI group and learning so much from these weekly challenges. Click below to see some of my solutions.
- Default
- Title
- Date
- Random
- Basic KPI Reports. With interactivity, drill through function and accessibility enhancements.Part of the Power BI Work Out…Read More
- Power BI: Drill Down (and up). To provide end-users with control to dig into more granular data.Part…Read More
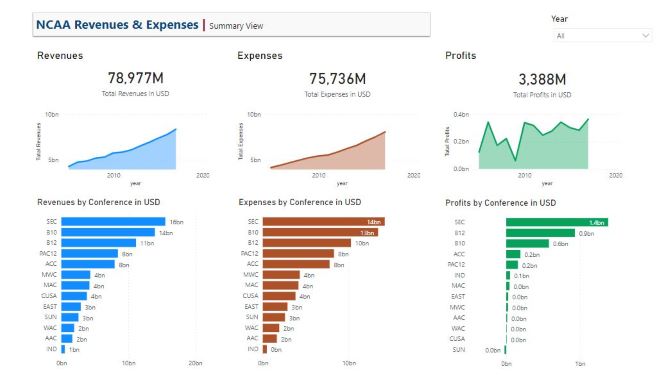
- Conditional Formatting, Forecasting and Anomaly Detection. Using three of Power BI’s five conditional formatting options to…Read More
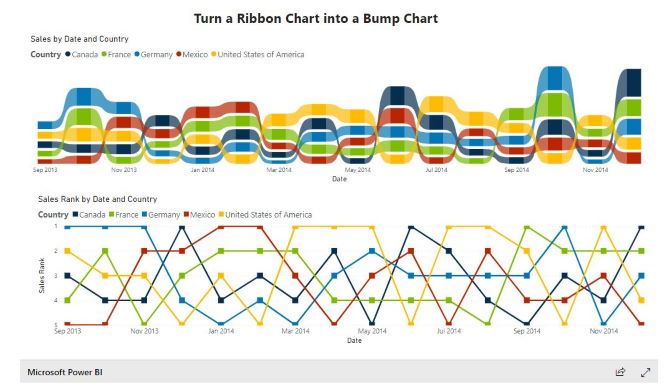
- Turn a Ribbon Chart into a Bump Chart. Quick way to display rank change, one…Read More
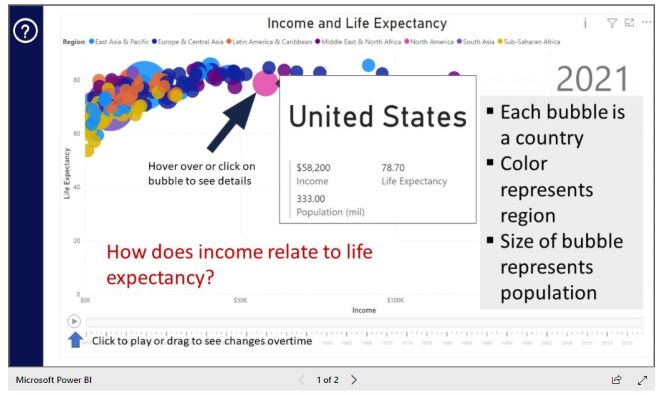
- Bubble Chart with a Custom Overlay. Custom page overlay, using Unpivot for additional data preparation.Part…Read More
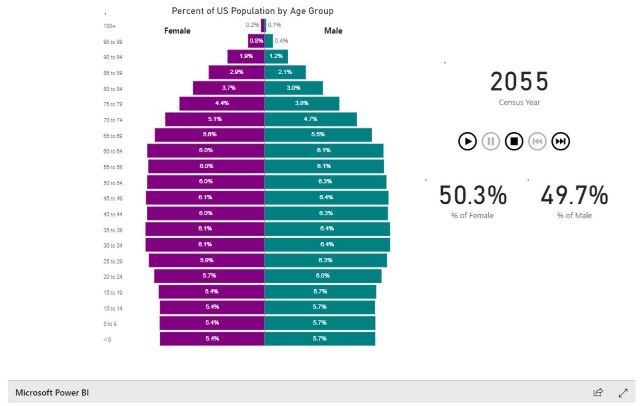
- Power BI: Age Pyramid. Create what demographers refer to as an Age Pyramid, in which each…Read More
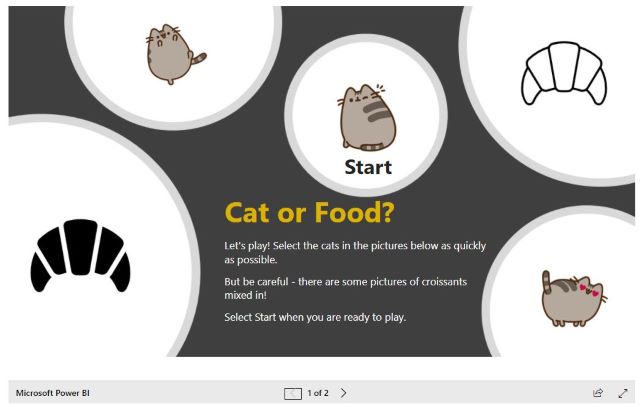
- DAX Trick – Cat or Croissant. Created a DAX formula that populates the current results of…Read More
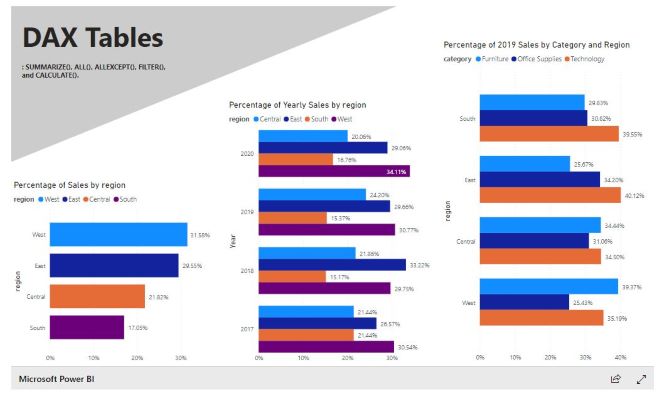
- Power BI: DAX Tables. Create ad-hoc tables and answering some questions using DAX and validating results.Part…Read More
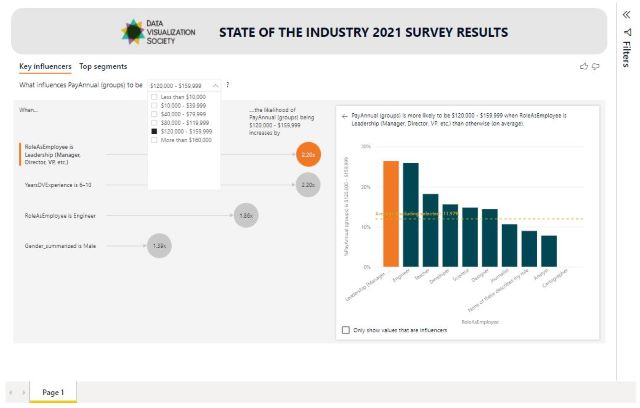
- Key Influencers. Explore Data Visualization Society‘s annual "State of the Industry 2021" survey results. This…Read More
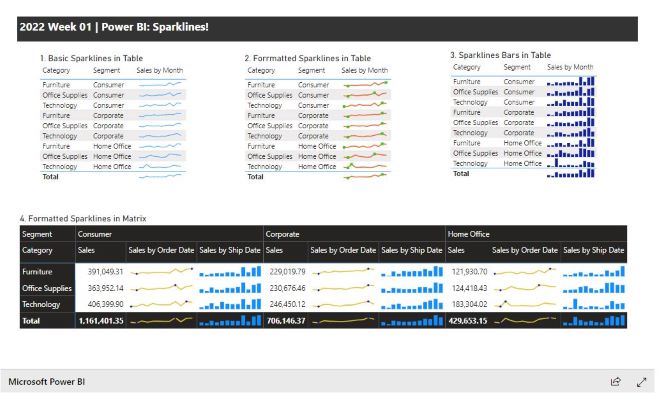
- Power BI: Sparklines! Create a report using sparklines in table and matrix visuals.Part of the Power…Read More
- Simplified Custom Page Navigation. This challenge was to create a report using an inbuilt custom page…Read More
- Visualize percent differences from a selected date - Yahoo Stock API. Create a line chart by…Read More
- Power BI: Hex Maps. Create a Hex Map using Synoptic Panel which allows you to…Read More
- Nested Chart with Charticulator. Create nested charts with Charticulator which allows you to design charts…Read More
- Power BI: Parallel Sets. Create a parallel set visual using the Data Visualization Society‘s annual…Read More
- Power BI: Gantt Chart. Create a Gantt Charts in Power BI. They are 4 variations to complete…Read More
- Power BI: Risk Matrix. Create a Risk Matrix with some supporting visuals using Synoptic Panel. The…Read More
- Project Budget Tracker. Create a Project Budget Tracker leveraging the IT Spend Analysis example dataset…Read More
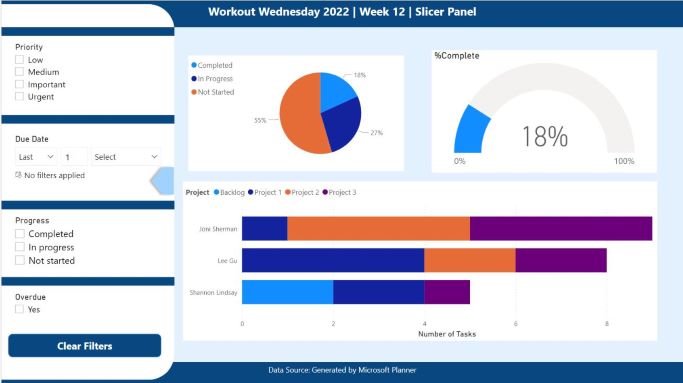
- Power BI: Slicer Panel from Microsoft Planner. Create a slicer panel in a report, using…Read More


Check my homepage here: Siri Shultz - Power BI
See more of my portfolio too: DAX and Power BI Portfolio